SQL insights enable you to directly access data in PostHog using SQL queries. They're powered by HogQL.
SQL commands
You create SQL queries out of a list of commands that shape what data, filters, aggregations, and ordering we want to see.
SQL queries in PostHog don’t require the trailing semi-colon (
;) of traditional SQL queries.
SELECT
Use SELECT to select data (usually columns, transformations, or aggregations) from one or more tables in the database. You can use arithmetic or functions to modify the selected data.
Common values to select are * (representing all), event, timestamp, properties, and functions like count(). You can access properties using dot notation like person.properties.$initial_browser. These values can be found in the data management properties tab or inside tables in the database warehouse tab.
Add the DISTINCT clause to SELECT commands to keep only unique rows in query results.
FROM
Use FROM to select the database table to run the queries on. In PostHog, examples include events, groups, raw_session_replay_events, and more listed in the data management database tab.
FROM also enables you to break down your query into subqueries. This is useful for analyzing multiple groups of data. For example, to get the difference in event count between the last 7 days and the 7 days before that, you can use two subqueries like this:
JOIN
You can query over multiple tables together using the JOIN command. This combines the tables and returns different records depending on which of the four conditions you use:
INNER JOIN: Records with matching values in both tables.LEFT JOIN: All records from the left table and the matched records from the right table.RIGHT JOIN: All records from the right table and the matched records from the left table.FULL JOIN: All records matching either the left or right tables.
The command then takes one table before it and another after it and combines them based on the join condition using the ON keyword. For example, below, the events table is the left table and the persons table is the right table:
This is especially useful when querying using the data warehouse and querying external sources. For example, once you set up the Stripe connector, you can query for a count of events from your customers like this:
WHERE
Use WHERE to filter rows based on specified conditions. These conditions can be:
- Comparison operators like
=,!=,<, or>= - Logical operators like
AND,OR, orNOT. These are often used to combine multiple conditions. - Functions like
toDate,today() - Clauses like
LIKE,IN,IS NULL,BETWEEN
To have the insight or dashboard date range selector apply to the insight, include {filters} in query like this:
WHERE is also useful for querying across multiple tables. For example, if you have the Hubspot connector set up, you can get a count of events for contacts with a query like this:
GROUP BY
Use GROUP BY to group rows that have the same values in specified columns into summary rows. It is often used in combination with aggregate functions.
ORDER BY
Use ORDER BY to sort the query results by one or more columns. You can specify order by ascending with ASC or descending with DESC.
LIKE
Use LIKE to search for a specified pattern in a column. This is often done in the WHERE command. You can also use ILIKE to make the search case insensitive.
Use the % sign to represent any set of characters (wildcard). Use the _ sign to define a single character wildcard.
For example, to get all the current URLs that contain the string "docs" you can use:
AS
Use AS to alias columns or tables with different names. This makes the query and results more readable.
LIMIT
Use LIMIT to restrict the number of rows returned by the query. It specifies the maximum number of rows the query should retrieve. By default, PostHog sets it at 100.
To paginate results, you can use the OFFSET command. For example, to get the 101-150th rows, you can use it like this:
HAVING
Use HAVING with the GROUP BY command to filter the results based on aggregate function values. While WHERE filters rows before grouping, HAVING filters grouped results after aggregation.
WITH
Use WITH to define a temporary result set that you can reference within a larger query. It helps break down complex queries into smaller parts. You can think of it as a function that returns a temporary table similar to using a subquery in a FROM command. The difference is that we query WITH subqueries each time they are used, potentially leading to slower queries.
WINDOW
Use WINDOW to query data across a set of rows related to the current row without grouping the rows in the output like aggregates do. This is useful for complex queries that need row-level detail while also aggregating data from a set of rows.
A window function contains multiple parts:
PARTITION BY: Divides the rows into partitions which the function then applies to. Each partition is processed separately.ORDER BY: Sorts rows within each partition.Frame Specification: Defines the subset of rows to include in the window such as
ROWS BETWEEN 1 PRECEDING AND 1 FOLLOWING.
It is useful for analysis like running totals, moving averages, ranking, and percentiles. For example, to get a running total of pageviews, you can:
CASE
Use CASE within the SELECT command to implement conditional logic within your SQL queries. It allows you to execute different SQL expressions based on conditions. It is similar to if/else statements in programming.
For example, to group properties.$os values in mobile, desktop, and other, you can use:
Comments
Use two dashes (--) to write comments.
Useful functions
HogQL includes many functions to aggregate and manipulate queried data. Below are some examples of some of the most popular SQL functions you can use in your insights.
Aggregate functions
These aggregate results for columns across all rows. They include:
avg(): Calculates the average numeric value of a column.sum(): Calculates the total (sum) numeric value of a column.max(),min(): Finds the maximum or minimum value of a column.
You can find a full list of these in supported aggregations.
Count
Use count() to count the number of rows in a particular column. count(*) counts all rows, while count(column_name) counts the number of non-null values in a column.
Regular functions
HogQL provides many functions for accessing, modifying, and calculating data from queries. Along with the ones listed below, many basics include calculation operators (+, -, /, *), type conversions (toInt, toString), conditional statements (if, multiIf), and rounding (floor, round).
You can find a full list of these in supported ClickHouse functions.
Date and time
now(),today(),yesterday(): Returns the current time, date, or yesterday’s date respectively.interval: A length of time for use in arithmetic operations with other dates and times.toDayOfWeek,toHour,toMinute: Converts date number of day of week (1-7), hour in 24-hour time (0-23), and minute in hour (0-59).toStartOfYear,toStartOfMonth,toMonday,toStartOfDay,toStartOfMinute: rounds date down to the nearest year, month, Monday, day, hour, or minute respectivelydateDiff('unit', startdate, enddate): Returns the count inunitbetweenstartdateandenddate.formatDateTime: Formats a time according to a MySQL datetime format string.
Read more examples in How to do time-based breakdowns (hour, minute, real time) and Using HogQL for advanced time and date filters.
String
extract: Extracts a fragment of a string using a regular expression.concat: Concatenates strings listed without separator.splitByChar,splitByString,splitByRegexp,splitByWhitespace: splits a string into substring separated by a specified character, string, regular expression, or whitespace character respectively.match: Return whether the string matches a regular expression pattern.replaceOne,replaceRegexpOne: Replace the first occurrence of matching a substring or regular expression pattern respectively with a replacement string.trim: Remove specified characters (or whitespace) from the start or end of a string.upper,lower: Converts a string to uppercase or lowercase.
Read more in How to analyze autocapture events with HogQL.
JSON
You can access nested data in JSON and objects directly.
You can parse JSON with JSONExtractRaw() to return a value.
Specialized JSONExtract functions exist for different data types including:
JSONExtractFloatJSONExtractArrayRawJSONExtractStringJSONExtractBool
Array
arrayElement(arr, n): Retrieves the element with the index of n from the arrayarr.arrayJoin(arr): Takes a row and generates multiple rows for the number of elements in the array. It copies all the column values, except the column where this function is applied. It replaces the applied column with the corresponding array value.
Read more in How to filter and breakdown arrays with HogQL.
Sparkline
A sparkline is a tiny graph contained in one cell of your query result. As an argument, it takes an array of integers.
You can use it to visualize queries, such as a 24-hour $pageview count for different $current_url values.
You can also use it for art.
Session replays
You can create a button to view the replay for a session by using the recording_button() function with the session_id. For example, to get a list of recent replays, you can use:
Accessing data
Strings and quotes
Quotation symbols work the same way they would work with ClickHouse, which inherits from ANSI SQL:
- Single quotes (
') for Strings literals. - Double quotes (
") and Backticks (`) for DataBase identifiers.
For example:
Types
Types (and names) for the accessible data can be found in the database, properties tabs in data management as well as in the data warehouse tab for external sources. They include:
STRING(default)JSON(accessible with dot or bracket notation)DATETIME(inISO 8601, read more in our data docs)INTEGERFLOATBOOLEAN
For example:
This works because $screen_width and $screen_height are both defined as numeric properties. Thus you can multiply them.
To cast a string property into a different type, use type conversion functions, such astoString, toDate, toFloat, JSONExtractString, JSONExtractInt, and more.
Property access
To access a property stored on an event or person, just use dot notation. For example properties.$browser or person.properties.$initial_browser. You can also use bracket notation like properties['$feature/cool-flag'].
Nested property or JSON access, such as properties.$some.nested.property, works as well.
PostHog's properties include always include
$as a prefix, while custom properties do not (unless you add it).
Property identifiers must be known at query time. For dynamic access, use the JSON manipulation functions from below on the properties field directly.
Some queries can error when accessing null values. To avoid this, use the COALESCE function to replace null values with a default value or filter NULL values with IS NOT NULL and use assumeNotNull to cast a column to a non-null type.
Actions
To use actions in SQL insights, use the matchesAction() function. For example, to get a count of the action clicked homepage button, you can do:
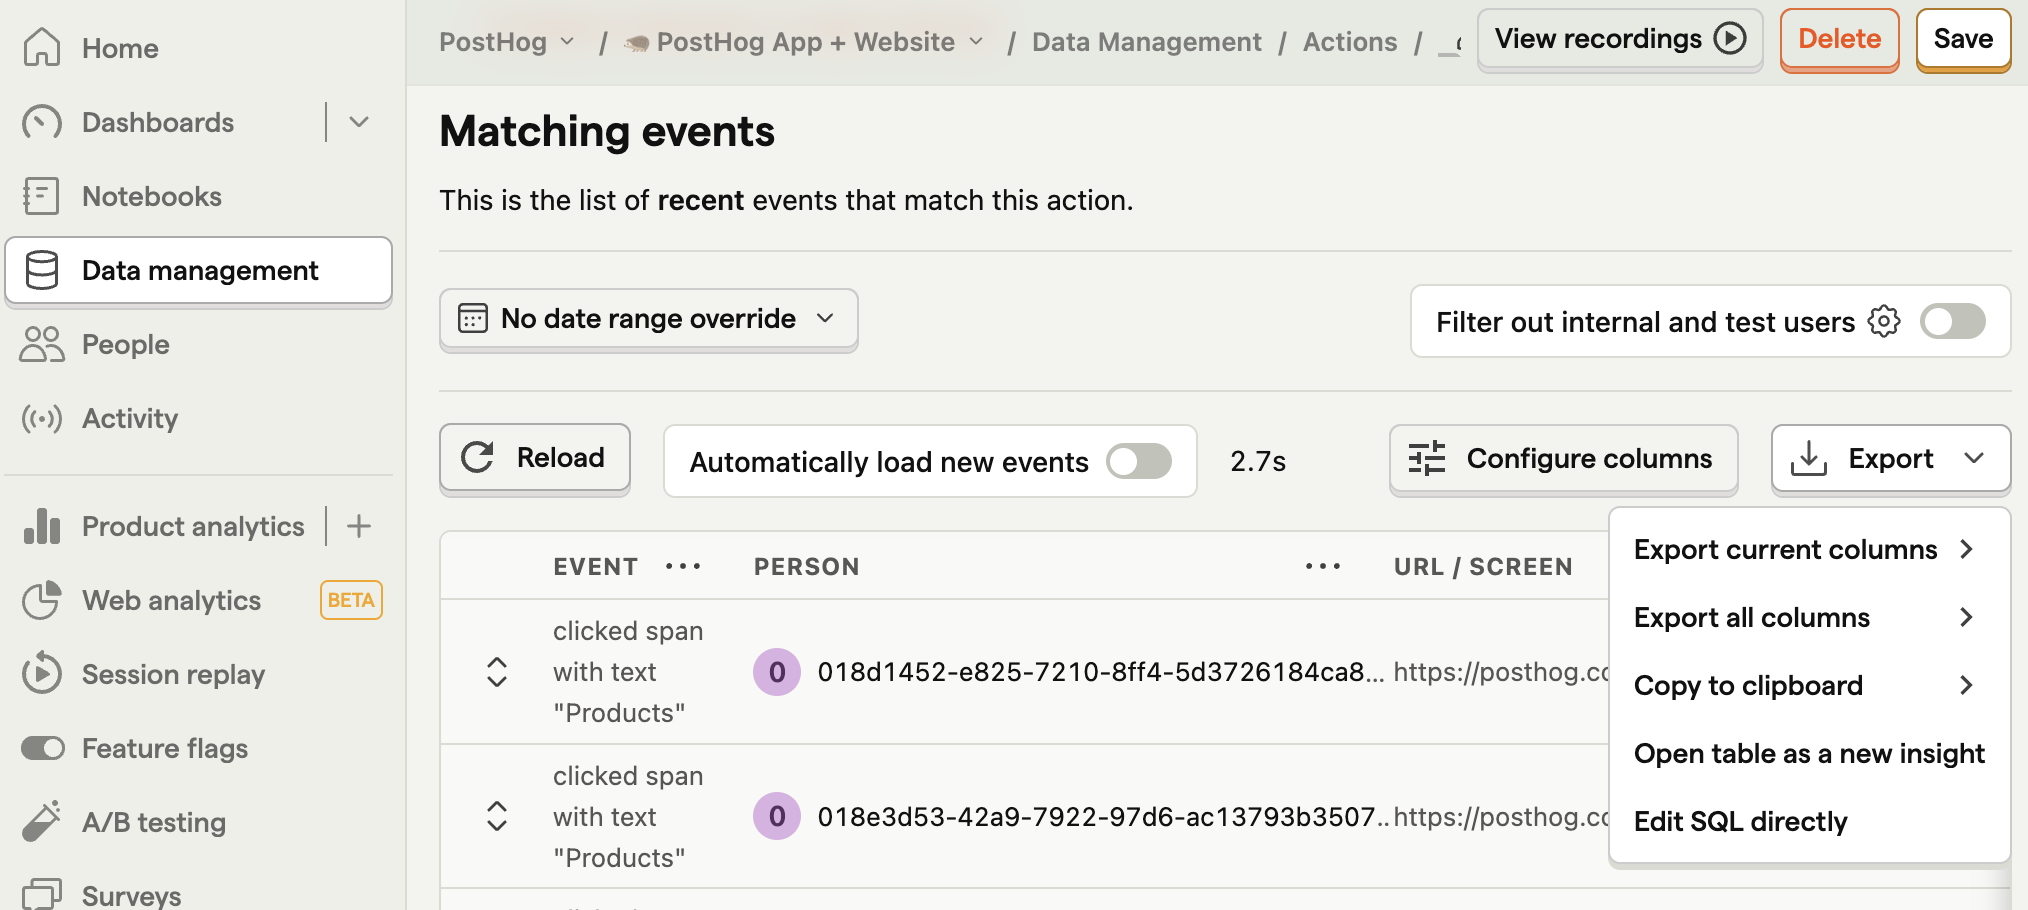
For more customization when using actions, start by selecting you action in the actions tab under data management.
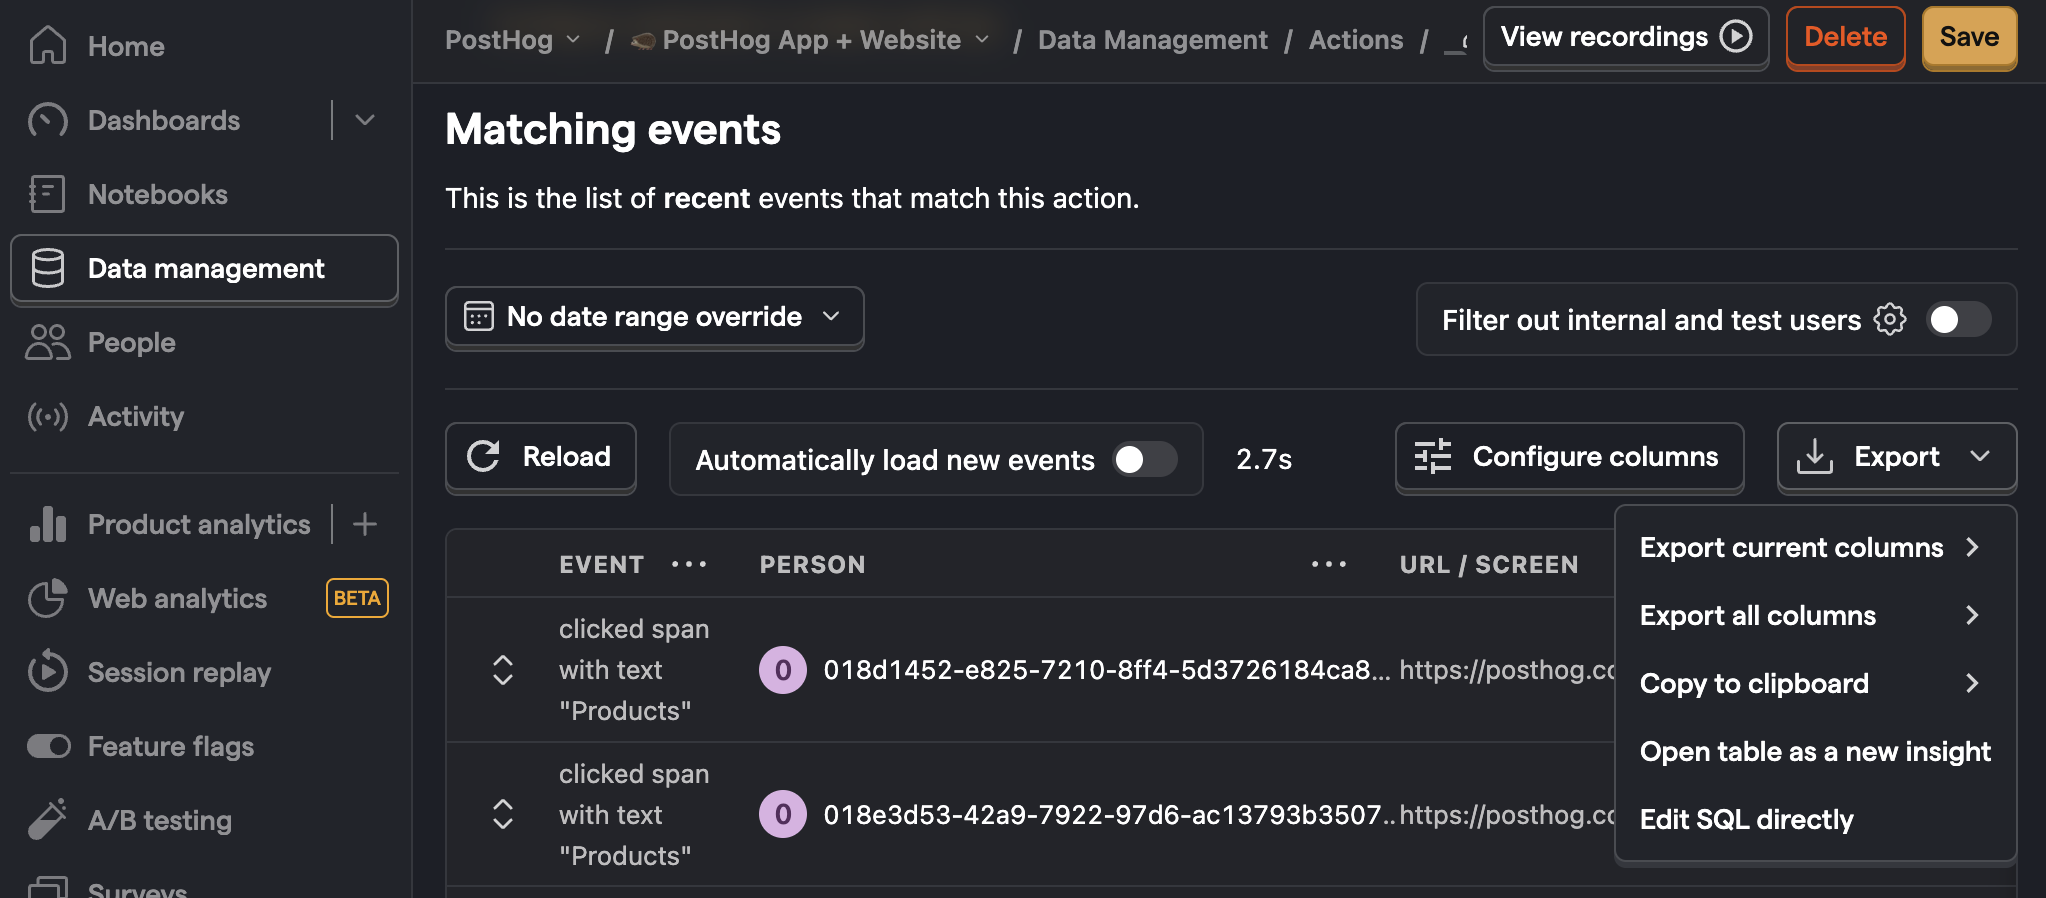
In the action details under "Matching events," click the export dropdown and select "Edit SQL directly."


This opens an SQL insight using the action. You can then copy parts of the SQL, like the WHERE filter or columns under SELECT, to use in your own insights.
Cohorts
To use cohorts in SQL insights, simply filter where person_id IN COHORT '{name}'.
For example, to get a count of users in the Power user cohort:
To get a count of events for users in the Power user cohort: